Marketing and Advertising Works, Right?
Case Study Background
Of course, marketing and advertising works. I also know that I'm biased but let’s not stop there. Let’s see if numbers — real data — actually PROVE that marketing is effective.
In this blog post, we are going to review a case example using data from one of our clients. I’m not able to divulge the name of the company but I can tell you that the numbers are real.
The company is located in Calgary, Alberta. They have been in the renovations industry for nearly 30 years. Our company, Anduro Marketing, has done a variety of marketing activities for them including Digital Marketing, Traditional Marketing (via a media buyer partner), Website Design Consultation, and in recent years Marketing Strategy Consulting.
Our recommendations for changes in strategy and tactics are a result of using data collected with our Revenue Catalyst software product. Revenue Catalyst is like an X-ray machine for marketing - it illuminates everything in marketing that is going right and everything that is going wrong.
In this post, we will specifically review data related to Marketing Investments, Sessions to the Website, Booked Sales generated and resulting Booked Revenues. The measures in each of these areas, for the year of 2018, are as follows:

Investments ($) include any expense related to marketing. These break down into four main areas:
Digital: SEO, Backlinking, Reviews, Paid Search, Display, Remarketing, Email
Social: Facebook, Instagram, Pinterest
Traditional: Radio, Out of Home Billboards, Signage on Trucks, Trade Shows
Internal: Customer Referrals, Repeat Business
Sessions (#) include all visits (including repeat visits) to the website as recorded by Google Analytics.
Booked Sales (#) is the number of projects sold in a month. One project is one sale. We did not include upsales or changes in scope during the project.
Booked Revenues ($) includes the total value of the sale in dollars as agreed upon at the time the agreement is made with the customer.
The basic premise of marketing is that there should be some desired outcome as a result of funds invested in marketing. If the investments are done wisely and effectively then there should be a positive correlation between the amount invested and the desired outcome (most often Sales and Revenue).
In this case study, we will review 3 desired outcomes:
Sessions (visitors) to the website
Booked Sales (#)
Booked Revenue ($)
As mentioned, we hypothesize that investments in marketing should correlate positively with these three outcomes. With this in mind, let’s look at three graphs (and a fourth later on).
Investments vs Sessions
In this first graph, we will plot the amount invested each month in marketing (Investments) and compare that to the number of visitors to the website (Sessions). Ideally, when the company invests funds into marketing and advertising, we would expect that the number of visitors to the website would increase, either immediately or shortly after the investment.

This is in fact what we observe when we compare these two measures. Investments in marketing (red line) were high in the last month of the first quarter and all during the second quarter. Sessions (blue columns) correlate very well with the investments made each month. As investments increase so do Sessions. As investments drop off later in the year, so do visit the website (Sessions).
Investments vs Booked Sales
Wouldn’t it be nice if there was an increase in sales when we spent money on marketing and advertising? Using our case example, let’s have a look. Just to be clear, what we want to see is more sales generated at some point in the future as a result of investing funds in marketing.
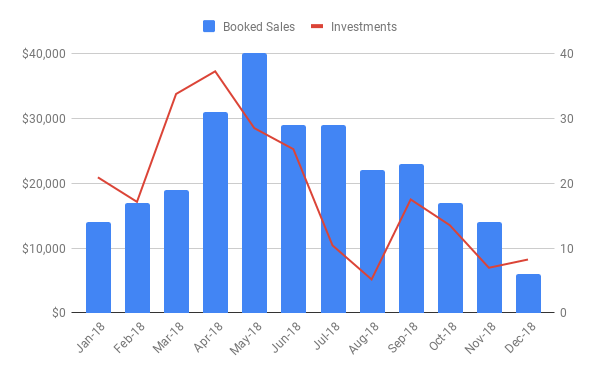
Notice in this chart that Investments (red line) are exactly the same as in the previous graph — high in the first two quarters and significantly less in the last two quarters of the year.
A quick look at Booked Sales (blue columns) shows us that there is a strong relationship between Investments and Booked Sales but that there is a lag in some months. In April there was a significant investment of $37,249 made in marketing but the jump in Booked Sales doesn’t occur until the following month, May. This is not uncommon.
A lag like this depends on a variety of factors such as time for customers to make a decision, the volume of orders that a company can process in a month, and the time of year. The lag between marketing investments and a closed sale will also vary between products, companies, industries and geographical areas.
In this case, the company in our case study made significant investments in traditional advertising including trade shows, billboards, and radio. Obviously, their investments paid off.
Investments vs Booked Revenue
It is possible to invest funds in marketing and have an increase in Sessions and an increase in Booked Sales but it doesn’t really matter if there is not an increase in Revenue. In our third chart, we will determine if there is a correlation between the funds invested in marketing and the resulting Booked Revenues generated.

In fact, this is what we see. As Investments increase so do Booked Revenues and as investments decrease so do Booked Revenues. Similar to the chart for Booked Sales, we can also see the lag between the Investments in April and the Booked Revenues generated a month later in May. We can also see a significant lag between the Investments in June and the resulting Booked Revenues in July and August. Better late than never!
Return on Marketing Investment
While we are looking at numbers and performance we might as well review the Return on Marketing Investment (ROMI). The formula for the calculation is [(Revenue — Investment) / Investment]. Although the $ signs cancel out, we format the resulting product with a dollar sign. An example would be $10. Essentially, the number means that for every $1 that we spend on marketing (subtracting the cost of the investment), we gain $10 back in Revenue. A table of the data is as follows:
Let’s look at the chart.

This chart is quite different from the preceding charts. In the previous charts, we saw a positive correlation between the Investments made and the desired outcomes. In this case, we see the opposite — when Investments are high, the ROMI is low and when Investments are low, ROMI is high. Why is this?
The answer is in the lag time that we discussed earlier. In this case study — with this company — high investments in marketing do result in an increase in Booked Revenues but there is a significant lag. The result is that in months like July and August when Investments are low but Booked Revenues are high, ROMI is high. Makes sense!
An Interesting Conclusion
Here is an interesting Year-over-year comparison. Same company. Same measures but different years.

Between the two years, there was a significant increase in Investments (15%).
Sessions increased by a similar amount (16%).
Booked Sales went up by a third (35%). Excellent!
Booked Revenues more than doubled (117%). Wow!
And ROMI doubled (99%). Impressive!
Overall this is FANTASTIC.
In the next post we will look at the changes that our client made in order to get such a significant improvement in Revenue and ROMI.
Jeff Nelson