Google Analytics Test - The Good, the Bad, and the Ugly
Have a look at the screenshots from Google Analytics for three clients that we have worked with over the last few years. I can’t say who is who.
Each company is in a different industry. Each company shown in the screenshots has about the same volume of Users - but the time frames are different. Each company is using different marketing strategies and marketing channels.
To start, ask yourself these questions (my analysis and answers are below):
What is the time frame in Google Analytics for each company?
What is the number of employees for each company?
What is the strongest channel, based on Users, for each company?
What is the weakest channel (ignore Other)?
Which primary channels are options but the company is not using?
Which company has the highest percentage of New Users
Which company has the lowest bounce rate?
Which company has the most Pages / Session?
Which company has the longest Avg. Session Duration?
Which company is engaging with Users the best?
Which social channels should each company focus on using?
Which company is the Good, the Bad, and the Ugly?
A) Research

B) Home Renovations

C) Information Technology (IT)
Analysis and My Answers
1. What is the time frame in Google Analytics for each company?
This is a tough question to answer without more information but here are the answers.
Research: 3 days
Renovations: 2 months
IT: 10 months
Comments:
This may be a surprise but to get 9,000 Users the IT company has to wait nearly 10 months. In contrast, the Research company only needs 3 days. That is a huge difference.
The Lesson:
Some companies have a strong brand, tons of users, and bags full of revenue. Others don’t. Your mission is to figure out how to be in the former and not the latter.
2. What is the number of employees for each company?
Another tough question.
Research: about 150
Renovations: about 20
IT: about 60
Comments:
As we will see a company doesn’t need to be big to generate high volumes of Users. The critical component is the budget spent on marketing. The other component that is critical is how effectively companies use various marketing channels and tactics.
The Lesson:
I don’t think there is a lesson here. Let me know if you agree or disagree.
3. What is the strongest channel, based on Users, for each company?
Research: Display
Renovations: Display (Also uses traditional media like tradeshows and billboards)
IT: Direct
Comments:
The IT company has not invested in Google Display Ads. This is a weakness of the company’s marketing strategy which lowers the awareness of the company and its brand strength.
The Renovations and Research companies are investing in Display and Paid Seach which is increasing awareness and the strength of the brand.
The Lesson:
Broadly, there are 3 reasons for marketing:
Increase Awareness
Increase Engagement
Increase Conversions
My first comment is “Every campaign that a company invests in should have at least one of these objectives.” My second comment is that most companies that are lacking conversions are often not investing enough in Awareness and Engagement campaigns. All marketing starts at the top of the funnel, not at the bottom.
4. What is the weakest channel? (Consider Social as one channel and ignore Other.)
Research: Email (ignore Other)
Renovations: Referral some channels are not being used
IT: Email, but some channels are not being used
Comments:
It is tough to get the Email channel to rank much higher than at the bottom. The main reason is that these are Users who have subscribed to the enewsletter. And people have to click on a link in the email to the website. AND all the pieces of technology need to be set up correctly, specifically UTM codes. Regardless, it is an important channel that nearly every company should be doing.
The Lesson:
Take the time to do blog posts (developing content) and sending out emails to deliver that content into the inboxes of people who are interested (subscribers).
5. Which primary channels are options but the company is not using?
Research: Using all primary channels
Renovations: Email
IT: Display, Paid Search,
Comments:
The Research company is using all digital marketing channels and as a result, they are doing well. There is more to marketing than using all channels and spending more money. But this company is using channels effectively to increase Awareness, Engagement, and Conversions.
The Lesson:
Experiment with different channels by doing short but intensive test campaigns. Consider doing a survey with your customers and prospects to determine which channels they use to gather information.
6. Which company has the highest percentage of New Users
Research: 82% - lowest
Renovations: 97%
IT: 98% - highest
Comments:
Each company has a different reason for developing a website but the Research company is clearly doing a better job of Engagement.
The Lesson:
If you want to drive up Awareness then use Display and Paid Search. If you want to drive up Engagement use social media channels. If you want to increase conversions, add ecommerce functionality to your website.
7. Which company has the lowest bounce rate?
Research: 51%
Renovations: 80% - most
IT: 6% - lowest
Comments:
The bounce rate is a funny metric. Most marketers would say having a low bounce rate is good. But as you can see having a bounce rate that is too low is not good either. The main issue with the IT company is that they haven’t invested in Awareness campaigns that drive up Users and also drive up the bounce rate because of an increase in people just taking a quick look.
The Lesson:
If your bounce rate is too high, develop content that is more engaging.
If your bounce rate is too low, you should think about investing in awareness campaigns.
8. Which company has the most Pages / Session?
Research: 3.55 minutes
Renovations: 1.40 minutes - least
IT: 6.36 minutes - most
Comments:
In this situation, the IT company has the most pages per session. At first, glance that may appear to be positive but the question that is triggered is: Are people finding what they want - quickly? It is possible that visitors are stumbling around the site trying to find something but they are having trouble. The reason may be the navigation or it may be that the information of interest is just not available which can be very frustrating for visitors.
The Lesson:
Figure out who you want to have as visitors to your site - i.e. your audiences. Then develop a navigation menu to help those visitors find what they are looking for. Finally, add content that is interesting and engaging for each audience.
9. Which company has the longest Avg. Session Duration?
Research: 2 minutes, 27 seconds - longest
Renovations: 0 minutes, 39 seconds - shortest
IT: 1 minute, 29 seconds
Comments:
The company that is keeping Users on their website the longest is the Research company. As a side note, this company has over 3,000 pages on their website. As a result, there is lots of content for people to read.
The Lesson:
If you want to engage with prospects and customers, develop content that is interesting and engaging. Content is still KING.
10. Which company is engaging with Users the best?
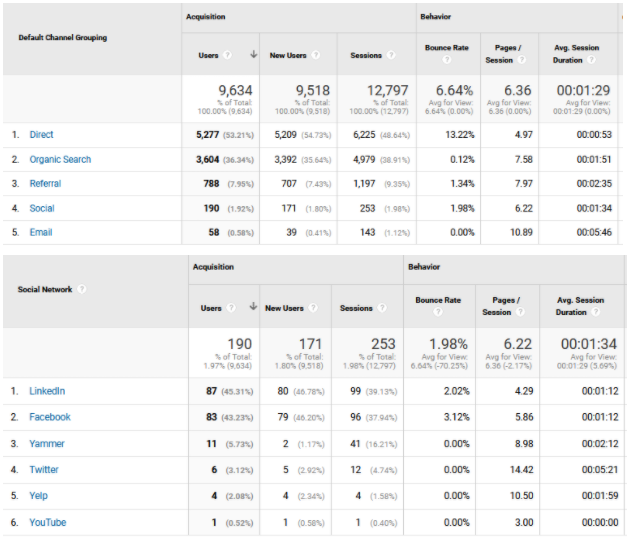
Research: 166 Users on Social channels in 3 days
Renovations: 160 Users on Social channels in 2 months
IT: 190 Users on Social channels in 10 months
Comments:
Clearly, the Research company is successfully using social channels to engage with customers. Facebook and LinkedIn are strong which makes sense because they have retail customers and business clients.
The Lesson:
Don’t forget social channels as a way to engage with your customers. Social channels have only been around for 16 years or so (LinkedIn launched in 2004) and if used correctly, they can be very powerful.
11. Which social channels should each company focus on using?
Research: Facebook and LinkedIn are working. Stick with those.
Renovations: Pinterest is working. Facebook is okay. Where is Instagram?
IT: LinkedIn is working and makes sense. Facebook is too.
Comments:
Companies focused on retail customers need to be on Facebook, Instagram, and maybe another channel like Pinterest. Companies that focus on other businesses should be using LinkedIn and maybe Facebook.
The Lesson:
Choose the channels that your customers are using. If you don’t know - ask them. Be selective - don’t use every channel. Get good - really good - at using the channels that you choose.
12. Which company is the Good, the Bad, and the Ugly?
With this question, we are trying to figure out which company is doing well, which one is mediocre, and which company is struggling?
Although Google doesn’t use this score any longer, a quick test for brand strength is Google PageRank. One website that we can use to check PageRank is Google PageRank Checker.
Comments:
The results are:
Research: PR=7 - the Good
Renovations: PR=3 - the Bad
IT: PR=0 - the Ugly
Based on the number of Users to the website, the Research company is doing very well. The Renovations company is doing okay. Finally, the IT company has a long way to go and lots of room for improvement.
Summary of Lessons:
First, figure out who you want to have come to your website - your audiences (markets)
Then, make sure that what they are looking for is easy to find - an easy to use navigation menu
Make sure you understand why they are coming - most likely a solution to a problem
Next, determine where they are coming from to get there - which marketing channel
Finally, provide the how for people to engage with people in your company - social channels
Simple, right? Let me know what you think. I’m interested in your thoughts and feedback.
Jeff Nelson