
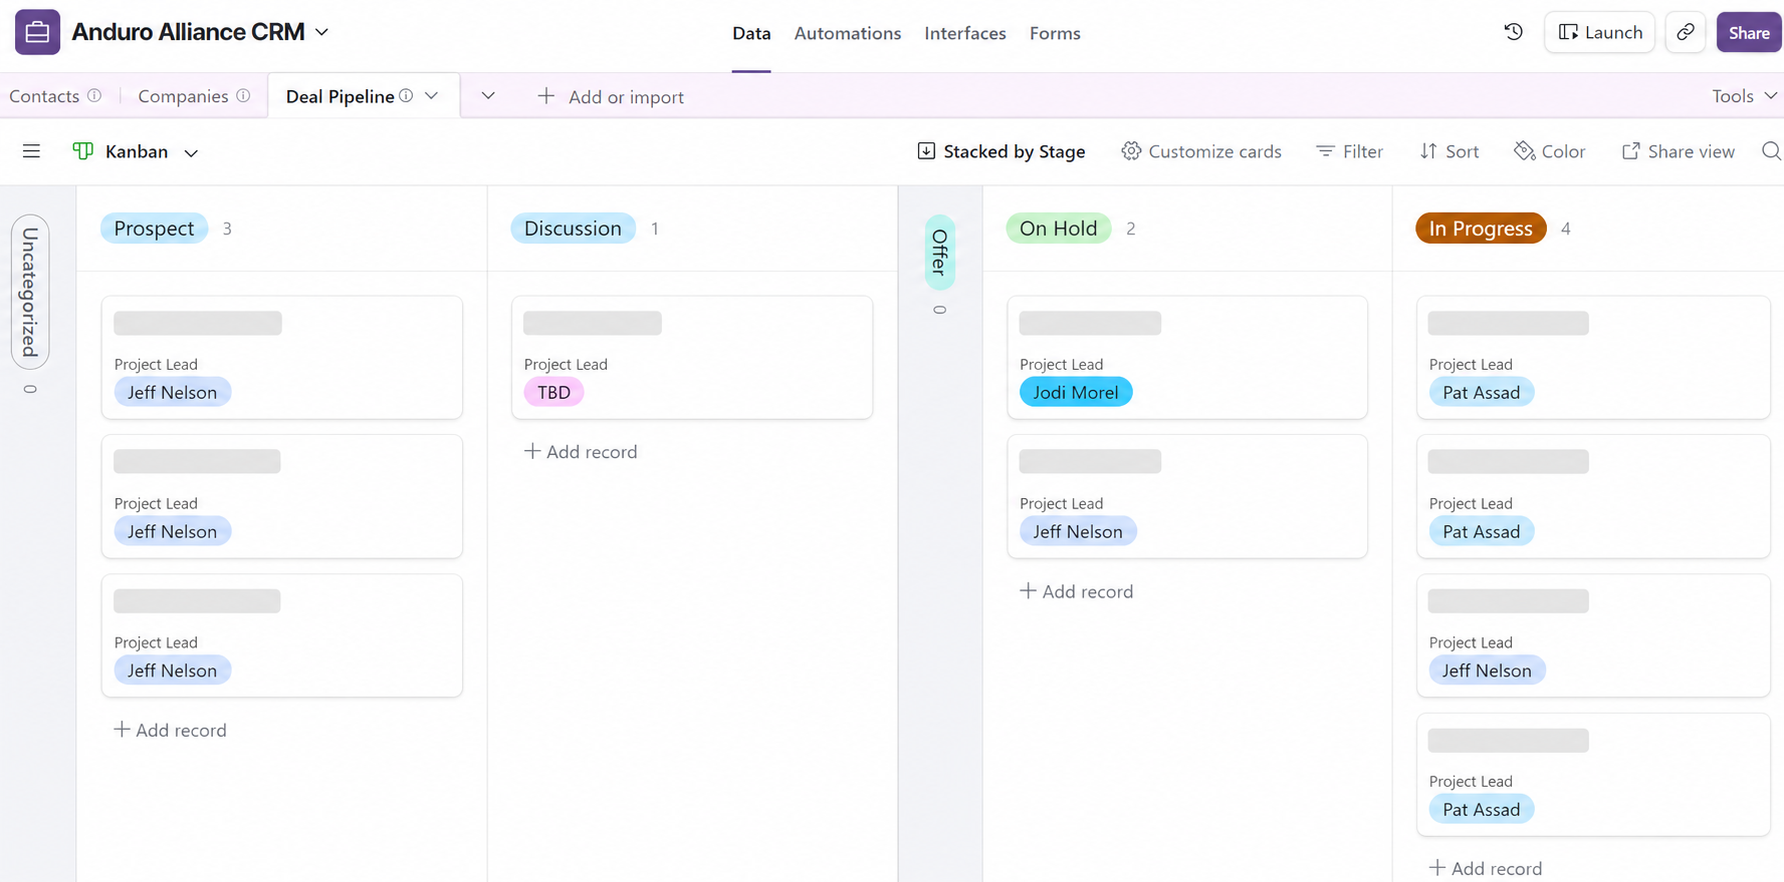
Why I Built My Own CRM
Why I built a custom CRM in Airtable, what I learned, and why small businesses need a system for tracking opportunities.

Good Product Comes First: The Wandering Inn
Marketing matters, but it cannot save a product that people do not want. In this post, I use my experience listening to The Wandering Inn, a 48-hour audiobook I finished and still wanted more of, to explain why product comes before market and marketing. A good product creates its own energy. Marketing works best when it helps the right people discover something genuinely worth choosing.
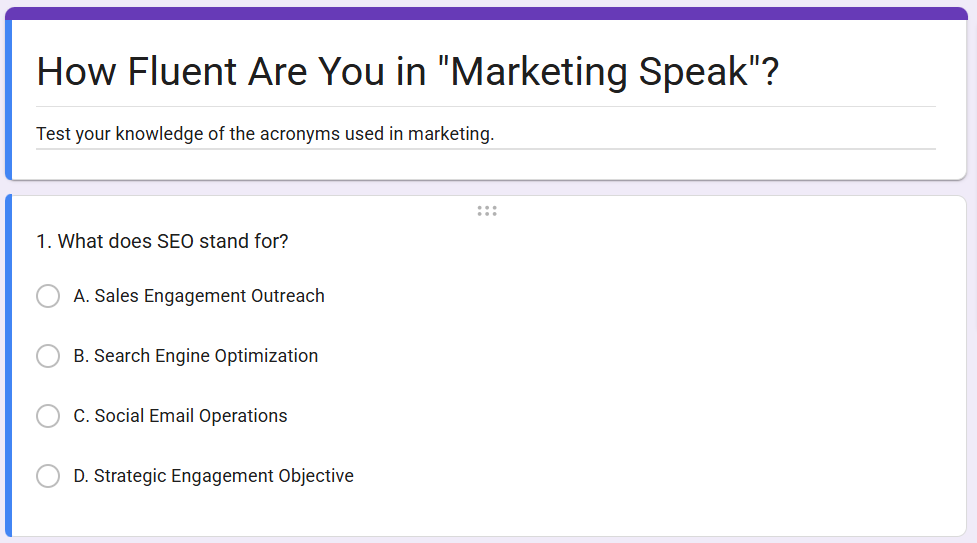
How Fluent Are You in "Marketing Speak"?
Try this quiz to see if you know any of the many acronyms used in marketing.

Marketing is Like Playing Wack-a-Mole
If your marketing feels chaotic, it’s because you’re playing the wrong game. This article shows why reactive marketing fails—and how to replace it with a focused strategy that actually works.
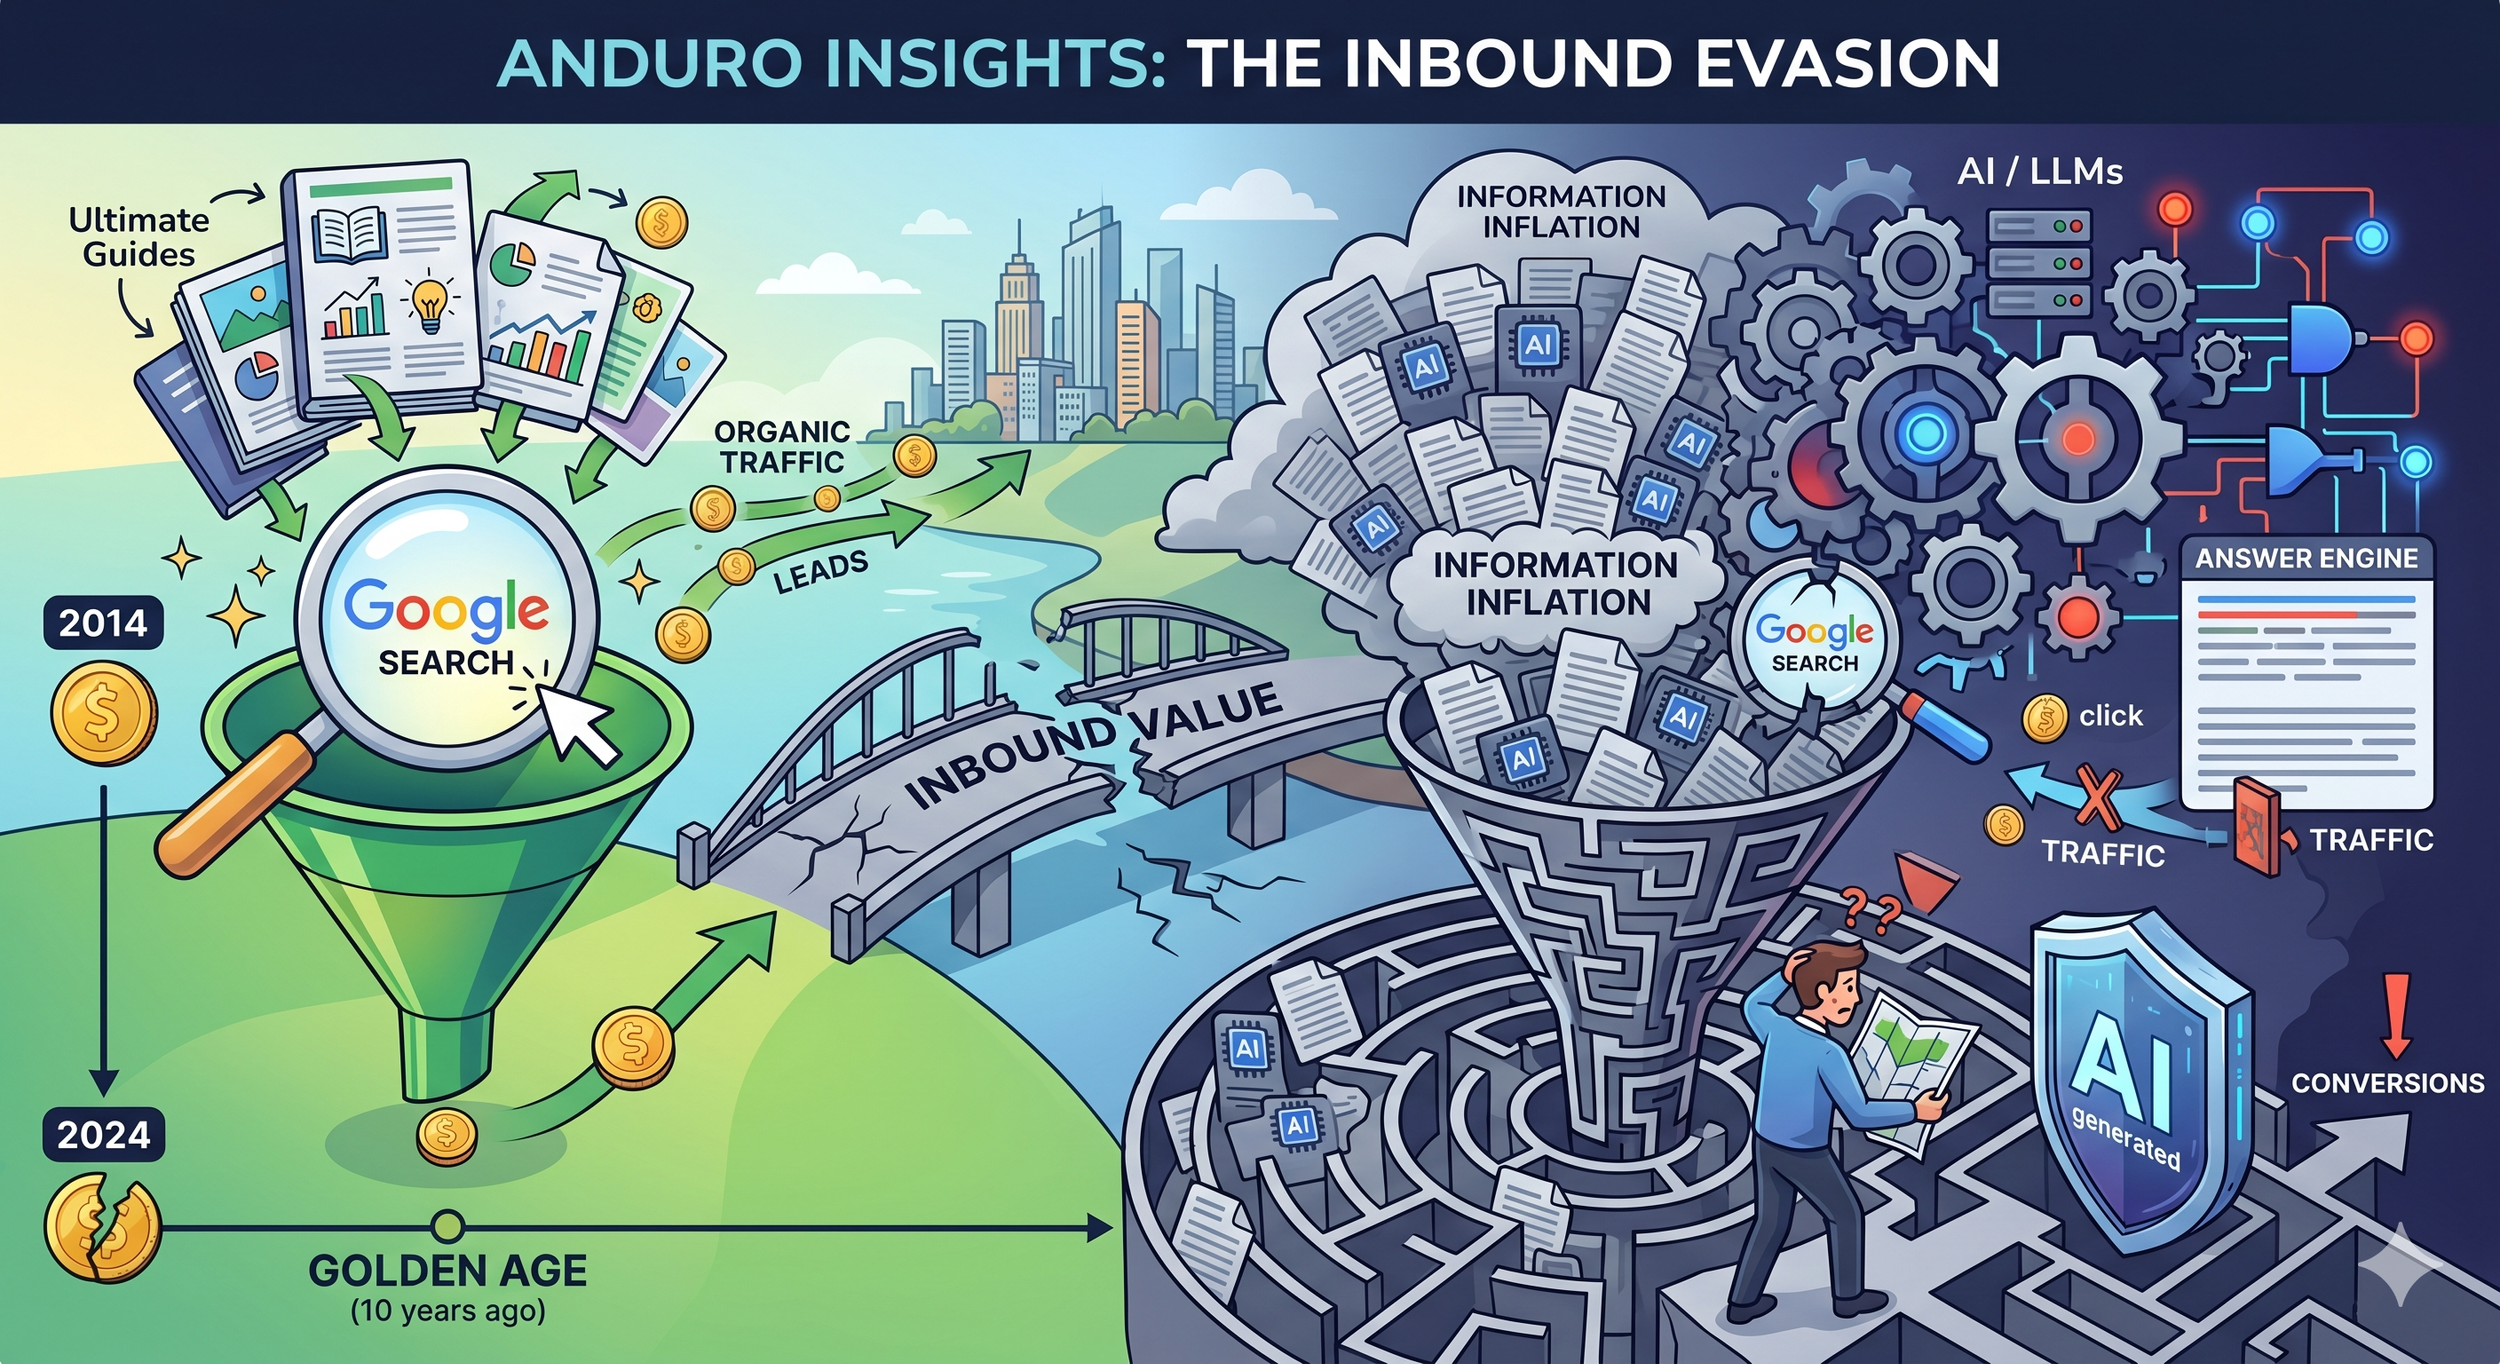
Inbound Marketing is Dead
Inbound marketing is losing effectiveness. Learn why content, SEO, and funnels are no longer enough—and what to replace them with.

Featured Alliance Partner: Craig Comstock
Craig Comstock spent over 20 years learning that most businesses don't need more "theory." They need a plan that works and eventually ends. Instead of a vague, open-ended arrangement, he breaks work down into defined phases with clear outcomes.

Featured Alliance Member: Nat Miletic
Nat is the owner of Clio Websites, and he has been quietly doing solid, thoughtful website work for a long time. The kind of work that does not need a drum solo, a funnel diagram, or a six-part manifesto to explain itself.
Measuring Marketing Performance Without Drowning in Data
More data does not lead to better marketing decisions. Clarity comes from focusing on a small set of metrics that connect marketing activity to revenue, conversion quality, and real engagement. Marketing performance is a frequent topic. Most discussions are about dashboards, reports, weekly numbers, and monthly reviews.

The Value of Sliding Doors
Sliding doors don’t demand effort. Great marketing works the same way. The best systems don’t require prospects to figure things out. They remove friction. They anticipate needs. They open at exactly the right moment.

Who Still Uses Business Cards? (Seriously, Who?)
Discover why business cards are obsolete in 2025 and what modern professionals are using instead.

Google is Dead
Is Google still king of search? Yes, but there are alternatives. This blog post explores how AI tools like ChatGPT are reshaping the way people search for information and what marketers need to do about it.

How Risk Tolerance Shapes Your Growth Strategy
This 2x2 matrix maps Sales Growth Potential (x-axis) against Risk Tolerance (y-axis). Whether you're bootstrapping a startup or managing a mature business, your position in this grid says a lot about your current strategy and where you want to go next.
Should I Focus on Profit or Revenue?
When evaluating a business or marketing strategy, one of the most important questions you can ask is: Should I prioritize revenue or profit? This 2x2 matrix offers a visual framework to assess your current position and guide your next steps. The vertical axis represents profitability, while the horizontal axis shows revenue scale.
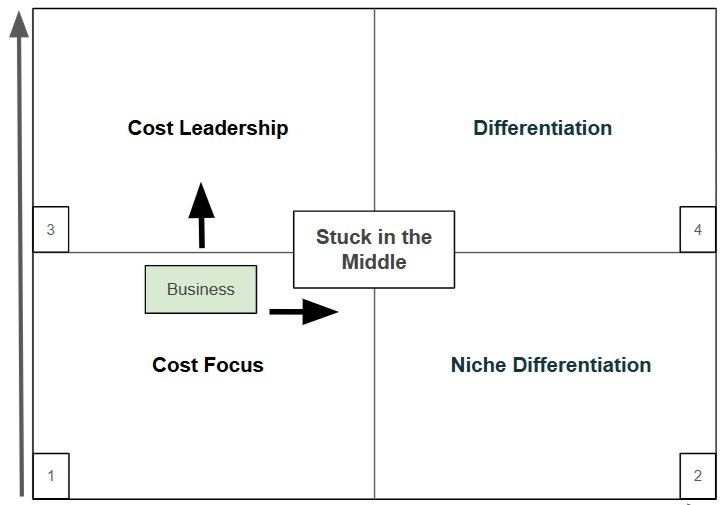
Competitive Strategies: Porter’s Generic Strategies That Work
In this post, I’ll break down Porter’s Competitive framework using Canadian companies that follow each of the four strategies.

Acton Central - New Private School
Today, I would like to feature one of our clients: Acton Academy Calgary Central.
Marketing Strategy - Free Session
I’m inviting you to a free session about marketing strategy. You will learn the difference between strategy, tactics, and a plan.
Step 5 - The Marketing Statement: Let’s Take A Look at Tukaluk
Looker Studio is an excellent platform to present a marketing statement and show key measures and critical metrics related to marketing. The marketing statement gives a quick overview of what is happening over the last few months and compare that to what happened last year for the same time period (assuming the measures are available).
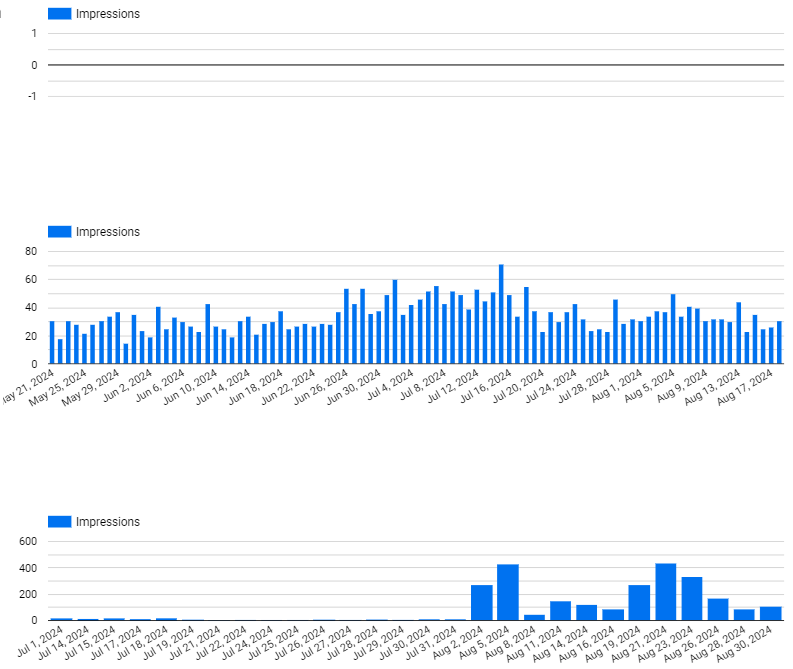
The Importance of Impressions: Let’s Take A Look at Tukaluk
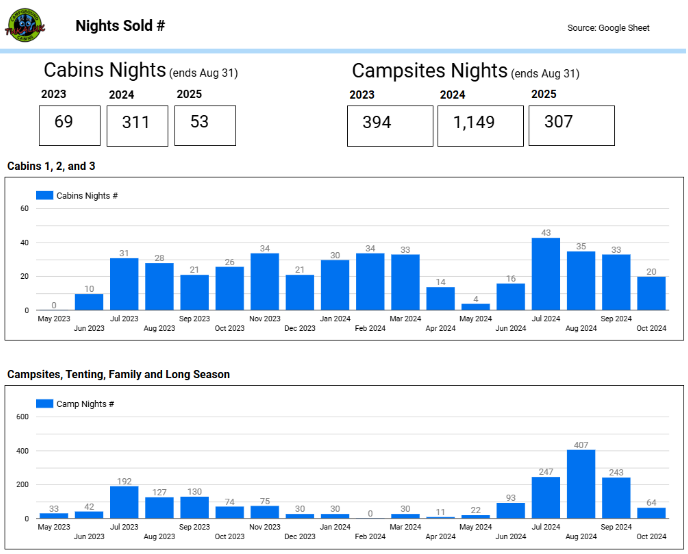
In recent years, our company has used Google’s data visualization product called Look Studio for our marketing reports. Even though Looker Studio has many limitations (which I won’t get into), I thought I would see if we could use this platform for our clients implementing the principles of Intentional Marketing (our book). David Cooper has graciously allowed us to use data from Tukaluk Campsite and Cabins for this purpose.

Awesome Tenting Campsite: Let’s Take A Look at Tukaluk
In our model, for the x-axis, there is a continuum of how intensive the owner wants to be. They can choose to be laid back or they can be aggressive. The y-axis relates to the portion of the market that the owner wants. They can aim to capture 100% of the market or a lesser portion. These are the variables that the owner must decide on.
The Intensiveness of Marketing is a Choice: Let’s Take A Look at Tukaluk
In our model, for the x-axis, there is a continuum of how intensive the owner wants to be. They can choose to be laid back or they can be aggressive. The y-axis relates to the portion of the market that the owner wants. They can aim to capture 100% of the market or a lesser portion. These are the variables that the owner must decide on.